Core Web Vitals in 2026: The Complete Optimization Guide
Everything you need to measure, diagnose, and fix Core Web Vitals — from first-time audits to advanced edge caching strategies. One guide, zero fluff.
A fast website used to be a nice-to-have. In 2026, it is a ranking signal, a conversion driver, and the baseline expectation of every visitor who lands on your page.
Google introduced Core Web Vitals to measure real user experience — not just raw page speed in a lab test, but how fast things load, how stable they look, and how quickly a page responds to interaction. This guide covers everything: what they are, how to test them, how to fix each one, and how they connect to schema markup SEO, crawl budget optimisation, and indexing issues.
1. What Are Core Web Vitals?
Think of Core Web Vitals as Google’s report card for how pleasant your website feels to real visitors. It is not about a lab score — it is about actual users loading your pages on real devices over real network connections.
Google defines them as three measurable signals covering loading performance, visual stability, and interaction responsiveness.
| Metric | Full Name | Measures | Good | Needs Work | Poor |
|---|---|---|---|---|---|
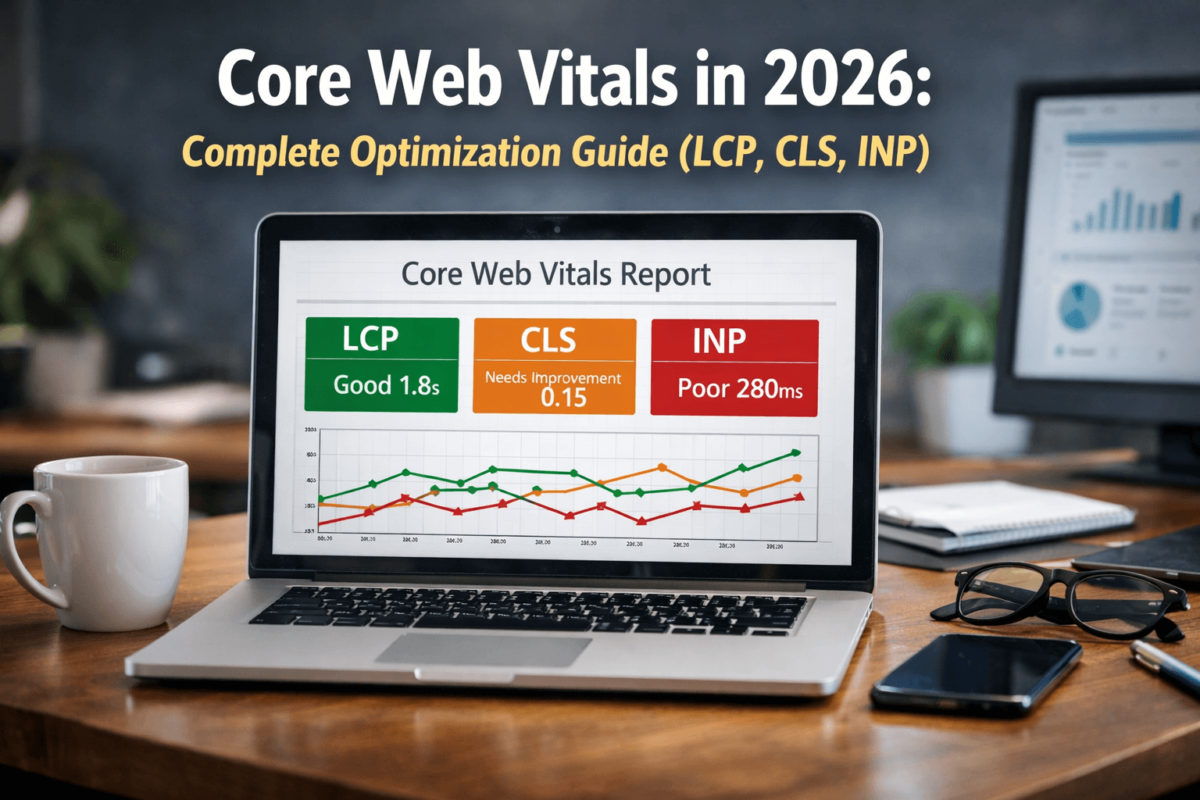
| LCP | Largest Contentful Paint | Loading performance | < 2.5s | 2.5 – 4s | > 4s |
| CLS | Cumulative Layout Shift | Visual stability | < 0.1 | 0.1 – 0.25 | > 0.25 |
| INP | Interaction to Next Paint | Interaction responsiveness | < 200ms | 200 – 500ms | > 500ms |
INP replaced FID in March 2024
First Input Delay only measured the delay before the very first interaction. INP captures the responsiveness of every interaction throughout the full session — making it a far more accurate picture of how responsive a page actually feels.
CWV scores use field data from the Chrome User Experience Report (CrUX) — real user measurements from Chrome browsers worldwide. Lab tools like Lighthouse are useful for debugging but it is the field data that Google uses as a ranking signal.
Official reference: web.dev/vitals →
2. Why Core Web Vitals Matter for SEO
Google officially incorporated Core Web Vitals into its ranking algorithm as part of the Page Experience update. The impact goes well beyond rankings alone.
The crawl budget connection most guides miss
If your site has hundreds of pages and server response time is consistently above 500ms, Googlebot may quietly deprioritise your newer content. Improving TTFB is one of the highest-ROI fixes for large sites — it benefits both users and crawl efficiency simultaneously.
Indexing Issues & JavaScript Rendering
JavaScript-heavy sites can suffer incomplete indexing because Googlebot renders JS in a deferred second wave — sometimes days later. Improving LCP and INP by reducing JS weight directly improves indexing reliability for the pages that matter most.
3. The 3 Core Web Vitals Explained in Depth
The most common LCP culprits in real audits:
- Unoptimised hero image — a 2–5 MB JPEG that could be 80–200 KB in AVIF format
- Slow server TTFB — response times above 600ms delay everything downstream
- Render-blocking JavaScript — scripts that must load and execute before the page renders
- No CDN — serving assets from the origin server instead of edge nodes close to the user
The most common causes of high CLS:
- Images without width/height attributes — browser cannot reserve space before the image loads
- Ads loading asynchronously — injecting content that pushes everything else down
- Web fonts causing FOUT — the Flash of Unstyled Text causes a reflow when the real font arrives
- Dynamic content above the fold — cookie banners, promotional popups, live chat widgets
What causes poor INP — the main thread is always the bottleneck:
- Long JavaScript tasks — any task over 50ms blocks user input from being processed
- Heavy event handlers — too much work per click, especially on menus and filters
- Third-party scripts — chat widgets, analytics, and ad networks competing on the main thread
- Large component trees — React/Vue re-renders that fire on every interaction
4. How to Measure Core Web Vitals
There are two types of CWV data: field data (real users via CrUX) and lab data (simulated tests). Field data is what Google uses for rankings. Lab data is more actionable for debugging specific issues.
Pulls 28 days of CrUX field data and runs a Lighthouse lab test simultaneously. The fastest way to audit any URL. Start every audit here. pagespeed.web.dev →
Shows CWV data aggregated site-wide — Good, Needs Work, Poor URL counts. Essential for identifying systemic issues affecting entire page templates. search.google.com →
Built into Chrome DevTools. Best for diagnosing specific issues and testing fixes before deploying. Always run in Incognito mode to eliminate extension interference.
Shows real-time LCP, CLS, and INP scores as you browse. Perfect for verifying fixes on staging. Chrome Web Store →
5. Step-by-Step Fixes for Each Metric
Select a metric below to see the full fix workflow. All three address different parts of the performance stack — complete all of them for maximum score improvement.
Identify the LCP element
Open Chrome DevTools → Performance panel → record a page load → look for the LCP marker. PageSpeed Insights names the exact element and its current size directly in the report.
Optimise the LCP element
If it is an image: convert to WebP or AVIF, compress to under 200 KB, add fetchpriority="high" and loading="eager". If it is a heading, preload the font. If it is a video, optimise the poster image.
Improve Time to First Byte (TTFB)
Target TTFB under 200ms. Switch to faster hosting or a VPS, implement server-side caching (Redis, Varnish, or a full-page cache plugin), and deploy a CDN to serve assets from edge nodes.
Remove render-blocking resources
Add defer or async to non-critical JS. Inline critical CSS in the <head>. Use rel=preload on the LCP image and critical fonts so they start loading as early as possible.
Real Audit Insight
In most technical audits, the single biggest LCP culprit is an unoptimised hero image — often a 2–5 MB JPEG that could be 80–200 KB in AVIF. Fix this one element and LCP can jump from “Poor” to “Good” overnight.
Audit all images and media
Every <img> tag must have explicit width and height attributes so the browser pre-allocates space before the image loads. This single change eliminates the most common source of layout shift.
Reserve space for ads and dynamic content
Set min-height on all ad containers. Move cookie consent banners and promotional popups to the bottom of the viewport. Never inject new content above existing content during page load.
Fix font loading
Preload critical fonts with <link rel="preload" as="font">. Use font-display: optional to fall back to a system font rather than causing a layout reflow. Self-hosting fonts eliminates a DNS lookup on every visit.
Use transform-based animations only
CSS properties like margin, padding, top, and left trigger layout recalculations. Use transform and opacity instead — they run on the compositor thread and never cause layout shifts.
Find your slowest interactions
In Chrome DevTools Performance panel, record while clicking through the page. Red “long tasks” (over 50ms) in the main thread timeline are your targets. The Web Vitals extension also shows INP scores in real time.
Break up long JavaScript tasks
Any JS task over 50ms blocks user input. Use setTimeout(fn, 0) to yield back to the browser between work chunks. Or use scheduler.postTask() for priority-aware scheduling (Chrome 94+).
Reduce third-party script impact
Audit third-party scripts in PSI’s “Third-party code” section. Load chat widgets, social embeds, and analytics with defer. Consider moving them to a web worker using Partytown.
Implement code splitting
Split your bundle so only the code needed for the initial page is loaded. Lazy-load everything else on demand using dynamic import(). Webpack, Vite, and Next.js all support this natively.
6. Core Web Vitals & Technical SEO
Core Web Vitals sit at the centre of a technical SEO ecosystem. Understanding these connections unlocks a much more powerful strategy than treating CWV in isolation.
Compound SEO Advantage
Adding FAQPage schema to pages that already pass Core Web Vitals thresholds gives you a measurable compound advantage — better rankings from CWV + richer search appearance from structured data + improved CTR from FAQ snippets. These signals reinforce each other.
Most impactful schema types to implement: Article, FAQPage, Product, BreadcrumbList, and HowTo.
Schema.org · Google Structured Data Docs · Crawl Budget Documentation
7. Advanced Core Web Vitals Techniques
Once you have addressed the fundamentals, these techniques push your scores from “Good” to “Excellent” and create a competitive moat that is hard to close quickly.
Edge Caching & CDN
Run server logic at CDN edge nodes so even dynamic pages get sub-100ms TTFB globally. Cloudflare Workers, Vercel Edge Functions, and Fastly Compute all support this. Cloudflare Speed docs →
SSR & Static Site Generation
Moving from client-side rendering (CSR) to SSR or SSG dramatically improves both LCP and indexing reliability. SSG is fastest for stable content; SSR for dynamic; ISR gives you the best of both.
Critical CSS Extraction
Inline the CSS needed to render above-the-fold content directly in the <head> to eliminate a render-blocking stylesheet request. Tools like Penthouse or Next.js automate this at build time.
HTTP/3 & QUIC Protocol
HTTP/3 eliminates head-of-line blocking that slows multiplexed HTTP/2 connections — especially on mobile networks with packet loss. Most major CDNs support it natively with minimal configuration.
Resource Hints & Priority
Use rel=preload for LCP images and critical fonts, rel=preconnect for CDN and font hosts, and fetchpriority=high on the LCP element to hint the browser to load it first.
Code Splitting
Split JavaScript bundles so only the code for the current page is loaded. Lazy-load everything else on demand using dynamic import(). Webpack, Vite, and Next.js all support this natively.
8. Common Core Web Vitals Mistakes
Most CWV failures are not caused by a single catastrophic problem — they are caused by an accumulation of small, avoidable mistakes that compound over time.
🔌 Too Many Plugins (WordPress)
Every plugin adds CSS, JS, and database queries to every page load. Sites with 30+ active plugins almost always have LCP and INP problems. Audit plugins quarterly — remove everything non-essential.
📱 Ignoring Mobile Performance
Google uses mobile-first indexing. A site scoring 95 on desktop and 42 on mobile has a serious problem. Always optimise for mobile as the primary target — desktop is secondary.
🧱 Heavy Page Builders
Elementor, Divi, and WPBakery generate bloated HTML and CSS. Enable performance settings, remove unused CSS, and pick a lightweight base theme to regain control.
🖼️ Raw Unoptimised Images
Smartphone photos can be 4–12 MB. Never upload unoptimised images. Always resize, compress, and convert to WebP or AVIF before upload. Squoosh and Sharp make this fast.
📊 Excess Third-Party Scripts
Analytics, chat widgets, A/B test tools, and heatmaps all compete on the main thread. Audit them in PSI’s “Third-party code” section and remove anything not generating measurable business value.
🔁 Never Re-Testing After Changes
CWV scores degrade as new content, plugins, and scripts are added. Set a recurring monthly audit using Search Console and PageSpeed Insights. What passes today may fail in three months.
9. The Future of Core Web Vitals
Google has committed to evolving Core Web Vitals as user experience expectations change. Here is what the technical landscape looks like heading into 2027.
🔬 New Potential Metrics
Google is researching Smoothness (animation/scroll frame rates), soft navigation metrics for SPAs, and network quality-adjusted scores that account for connection type.
🤖 AI Rendering Challenges
AI-generated personalised content creates new TTFB pressure. Edge-based AI inference is emerging as the solution — running model inference at CDN edge nodes to avoid origin round-trips.
📏 Performance Budgets
More teams are enforcing hard limits on JS bundle size, image weight, and total page size at the CI/CD pipeline level using tools like Lighthouse CI, Calibre, and SpeedCurve.
🌍 Edge Computing as Default
By 2027, most production sites will default to edge-rendered or edge-cached architecture — pushing average TTFB times down across the web and raising the bar for what “Good” means.
Looking Ahead
Google’s direction is clear: UX signals will continue to grow in ranking weight. Core Web Vitals are not a temporary initiative — they are the foundation of performance-based SEO for the next decade.
10. Core Web Vitals Checklist for 2026
Click each item as you complete it. Progress is tracked automatically.
Progress: 0 / 20 completed
11. Frequently Asked Questions
What are Core Web Vitals?+
Core Web Vitals are three performance metrics defined by Google — LCP (loading speed), CLS (visual stability), and INP (interaction responsiveness) — used to measure real-world user experience. They are an official part of Google’s search ranking algorithm as page experience signals.
Do Core Web Vitals affect Google rankings?+
Yes. Core Web Vitals are an official Google ranking factor since the Page Experience update. While content quality and backlinks still carry more weight, CWV acts as a meaningful tiebreaker between pages with similar authority. Its influence is expected to grow as Google raises the bar for user experience standards.
What is a good LCP score in 2026?+
A good LCP is under 2.5 seconds. Between 2.5 and 4.0 seconds is “Needs Improvement.” Over 4.0 seconds is “Poor.” The LCP score that matters for SEO is the field data score from real users, not the Lighthouse lab score. Always check PageSpeed Insights field data for the most accurate picture.
How do I fix CLS on my WordPress site?+
Start by auditing every <img> tag — each must have explicit width and height attributes. Then check for ads loading without reserved space, and web fonts causing layout shift on load. Performance plugins like WP Rocket and LiteSpeed Cache include CLS-specific optimisation features worth enabling.
How do Core Web Vitals affect crawl budget?+
Slow server response times cause Googlebot to spend more time per page, reducing the total pages crawled per day. Improving TTFB to under 200ms and reducing HTML weight helps Googlebot crawl more efficiently — especially critical for large sites with thousands of pages or frequently updated content.
What replaced First Input Delay (FID)?+
INP — Interaction to Next Paint replaced FID in March 2024. INP measures the responsiveness of all interactions throughout a session, not just the first one. This makes it a far more accurate indicator of how responsive a page actually feels to real users.
How long until CWV improvements show in Search Console?+
Google’s CrUX data uses a rolling 28-day window. Changes typically take 4–6 weeks to fully reflect in Search Console and PageSpeed Insights field data. Use the Web Vitals Chrome extension to verify improvements immediately after deploying a fix — before waiting for the field data to update.
Final Verdict
Core Web Vitals are not just a technical checkbox. They represent how it actually feels to visit your website — and in 2026, that experience is a measurable, rankable signal.
Free tool by Google · No sign-up required
If your pages load fast, stay visually stable, and respond instantly to every tap — both users and search engines reward you. Optimise for humans first. Core Web Vitals are simply Google’s way of measuring whether you have done that job well.
Jaykishan is the founder of TechCognate, a publication dedicated to in-depth reviews and guides for SEO tools, technical optimisation strategies, and digital marketing. With hands-on experience running technical SEO audits across dozens of industries, he writes content designed to be immediately actionable for site owners, SEO specialists, and developers alike.