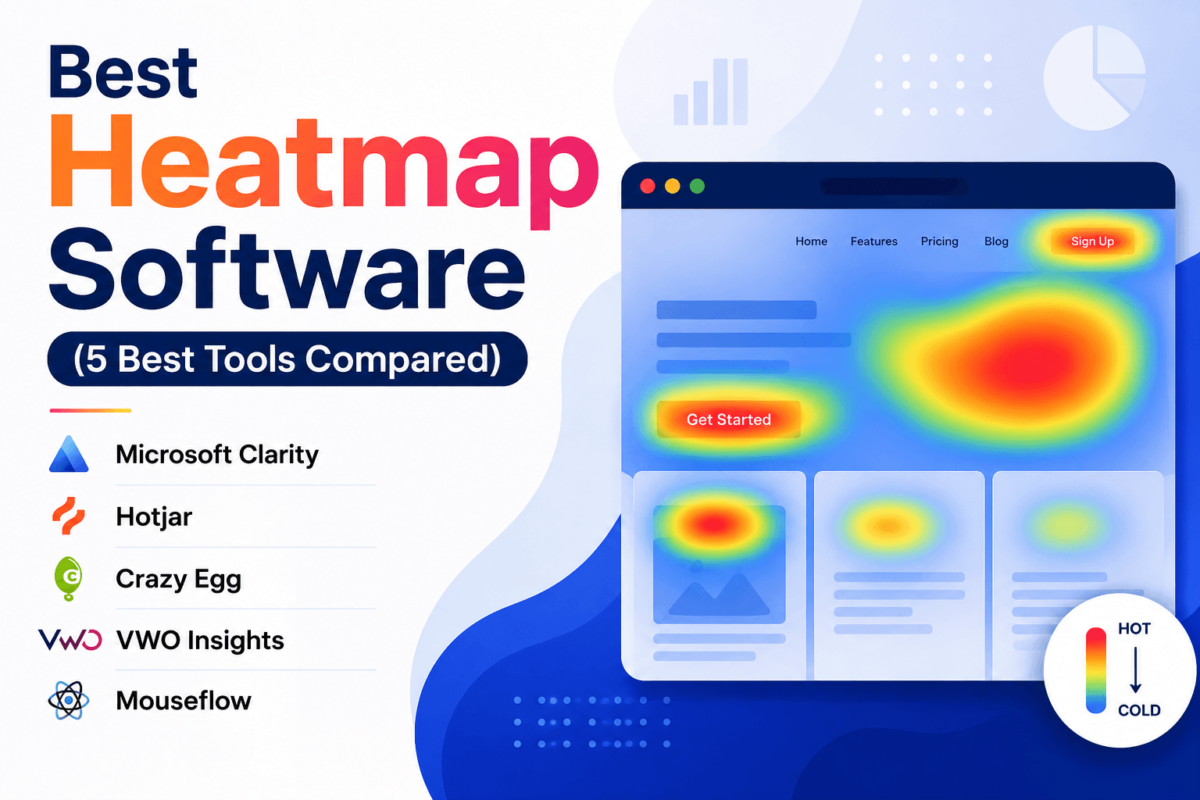
Best Heatmap Software: 5 Best Tools Compared (2026)
A practical, feature-by-feature comparison for bloggers, agencies, ecommerce stores, and everyone in between
⚡ Quick Answer
Here’s a question worth sitting with for a second: if 100 people landed on your homepage right now, could you tell me — without guessing — how many of them actually saw your call-to-action button? Not how many could have seen it. How many did.
Most site owners can’t answer that. Google Analytics tells you someone bounced. It doesn’t tell you they bounced because your pricing table looked broken on their phone, or because they scrolled straight past your “Buy Now” button thinking it was a banner ad. That’s the gap heatmap software fills — it shows you the page the way your visitors actually experienced it, not the way you designed it in Figma.
I’ve spent years pulling apart landing pages using tools exactly like the five below, and the honest truth is: most of the “insight” people think they’re getting from a heatmap is noise. The tool matters less than knowing what to look for. Still, the right tool makes that job dramatically easier — and some of these five are simply better built for specific jobs than others. This guide breaks down all five so you can pick the one that actually fits your site, not just the one with the loudest marketing.
Comparison Table: 5 Best Heatmap Tools at a Glance
| Tool | Best For | Starting Price | Free Plan | Session Recordings | Form Analytics | A/B Testing | AI Insights |
|---|---|---|---|---|---|---|---|
| Microsoft Clarity | Budget-conscious sites of any size | Free forever | Unlimited | Unlimited | No | No | Copilot AI summaries |
| Hotjar | UX research & cross-team collaboration | $0 / from ~$32–39/mo | 35 sessions/day | Yes (capped) | No | No | AI summaries |
| Crazy Egg | Simple heatmaps + native A/B testing | From ~$29–49/mo | Limited free tier | Yes (capped) | No | Yes | No |
| VWO Insights | Enterprise CRO programs | From ~$139–169/mo | Trial only | Yes | Yes | Full suite (add-on) | Yes |
| Mouseflow | Form and funnel friction diagnosis | $0 / from ~$31–32/mo | Limited free tier | Yes (capped) | Yes, field-level | No | Basic AI insights |
Pricing shifts often, and every one of these vendors adjusts tiers a couple times a year, so treat the numbers above as directional. Now let’s get into what each tool is actually like to use.
Individual Reviews: The 5 Best Heatmap Tools
1. Microsoft Clarity
Best Free OptionFree, unlimited, and legitimately good — the tool most small sites should install first.
Overview
Microsoft Clarity is the one entry on this list that breaks the usual “free plan = crippled plan” rule. It records every session by default, with no daily cap and no monthly quota, whether your site gets 50 visits a day or 50,000. That alone makes it an outlier: every paid competitor on this list caps recordings somewhere, and Clarity simply doesn’t. It installs with a single script tag or a plugin and starts producing heatmaps and session recordings almost immediately, which matters if you’re the kind of person who wants data today, not after a week of “learning mode.”
Key Features
- Click and scroll heatmaps generated automatically per page, no manual setup required.
- Unlimited session recordings, stored for 90 days, with no sampling.
- Rage click and dead click detection to flag places visitors get frustrated or click on things that don’t respond.
- Clarity Copilot, an AI layer that summarizes recurring behavior patterns in plain language instead of making you scrub through hours of video.
- Native integration with Google Analytics and Microsoft Ads, plus mobile app SDKs for iOS and Android.
Pros
- Completely free with no usage ceiling
- Two-minute install, zero configuration needed
- Captures 100% of sessions, no sampling gaps
- Genuinely useful AI summaries via Copilot
Cons
- No dedicated form analytics
- No built-in A/B testing
- Fewer segmentation options than paid tools
- No live chat support tier
Pricing
Free. There’s no paid tier, no seat limit, and no traffic-based pricing — which is unusual enough in this space that people often assume there’s a catch. There isn’t; Microsoft treats Clarity as a data-and-goodwill play tied to its ads and analytics ecosystem, so it doesn’t need your credit card.
Why We Recommend It
If you’re a blogger, a small ecommerce store, or an agency running heatmaps across a dozen client sites on a tight budget, there’s no rational reason to skip Clarity — even if you also install a paid tool. It’s the closest thing to a free lunch in this category. The gap it leaves is form-level analytics and A/B testing, which is exactly where a tool like Mouseflow or Crazy Egg picks up the slack. For CRO fundamentals, our guide to conversion rate optimization is a good next read once you’ve got Clarity installed.
2. Hotjar
Best OverallThe most balanced, best-known tool in the category — and still the default recommendation for most teams.
Overview
Hotjar has been the household name in this space since 2014, and even after its acquisition by Contentsquare, it’s stayed close to its original mission: make user behavior visible without a steep learning curve. It blends heatmaps, session recordings, and structured feedback tools (surveys, on-page polls, user interviews) into one dashboard, which is why product and marketing teams tend to gravitate toward it — it’s less “developer tool” and more “whole-team research hub.”
Key Features
- Click, move, and scroll heatmaps, viewable by device type (desktop, tablet, mobile) separately.
- Session recordings with filtering by rage clicks, u-turns, and error clicks.
- Hotjar Engage for recruiting and running live user interviews without a third-party tool.
- On-site surveys and feedback widgets that pair qualitative comments with the heatmap data.
- AI-generated summaries that cluster session recordings by theme, so you’re not watching 200 videos one at a time.
Pros
- Best all-around feature spread for research + CRO
- Genuinely free tier to start on
- Strong collaboration features for cross-functional teams
- Large integration library (Slack, Jira, GA4, Segment)
Cons
- Session recording caps tighten quickly as traffic grows
- Uses sampling, so peak-traffic days may be under-captured
- Pricing has shifted since the Contentsquare acquisition
- No native form-level drop-off analytics
Pricing
The free plan covers up to 35 daily sessions, which is fine for testing the tool but tight for a live site. Paid plans start in the $32–$39/month range and scale with monthly sessions, with the full-featured tier running well past $170/month once you need 500+ daily sessions captured.
Why We Recommend It
Hotjar earns “best overall” not because any single feature is unbeatable, but because nothing else on this list does research, heatmaps, and team collaboration this well in one place. If your priority is pure conversion-rate depth over research breadth, Mouseflow or VWO will out-perform it on specific tasks — but for the majority of teams asking “what should we install first,” Hotjar is still the safe, well-rounded answer. It pairs especially well with the practices in our UX signals and rankings guide.
3. Crazy Egg
Best for Simple A/B TestingThe most beginner-friendly heatmap tool with A/B testing baked in from day one.
Overview
Crazy Egg was one of the first heatmap tools on the market, and it still leans into that “point, click, understand” simplicity. It doesn’t try to be a full research suite — it focuses tightly on visualizing attention and letting you test variations of a page without needing a separate experimentation tool. That narrower focus is exactly why marketers without a technical background tend to prefer it: there’s very little setup friction between “install script” and “see useful data.”
Key Features
- Confetti reports — Crazy Egg’s signature feature, which segments click data by traffic source, device, referrer, and time of day, all in one visual.
- Snapshots combining heatmaps, scroll maps, and click reports per page.
- Built-in A/B testing with a visual editor, no code required for simple variant tests.
- Session recordings with searchable filters.
- Surveys for lightweight on-page feedback collection.
Pros
- Very easy to set up and read, even for non-technical users
- Confetti reports offer genuinely unique segmentation
- A/B testing included without a separate subscription
- Responsive, human customer support
Cons
- No rage-click or dead-click detection
- No dedicated form analytics or funnel building
- Billing is annual-only on most plans
- Pageview caps can feel restrictive on lower tiers
Pricing
Entry plans start around $29–$49/month (billed annually) for a limited number of tracked pageviews and recordings, moving up to roughly $99, $249, and $499–$599/month as you add pageview volume, heatmap reports, and recording limits. Every plan is annual-only, and Crazy Egg does not currently offer month-to-month billing on its published tiers.
Why We Recommend It
If your team wants to run a quick “does the red button beat the green button” test without spinning up a dedicated experimentation platform, Crazy Egg genuinely earns its keep. It’s not the deepest tool here, and it’s not the cheapest, but it’s the fastest to get real answers from if you’re not a CRO specialist. Pair it with our landing page builder comparison if you’re testing pages you haven’t built yet.
4. VWO Insights
Best Enterprise SolutionBuilt for teams that treat CRO as a full-time discipline, not a side task.
Overview
VWO Insights is the heatmap and behavior-analytics module inside the broader VWO experimentation platform, which also includes VWO Testing (A/B/multivariate testing), Personalize, and FullStack for server-side experiments. It’s rarely bought in isolation — most teams land here because they’re already running structured experimentation programs and want heatmaps and recordings feeding directly into the same environment where their tests live. That integration is the whole pitch: less time exporting data between tools, more time acting on it.
Key Features
- Heatmaps and scroll maps segmented by traffic source, device, and custom visitor attributes.
- Session recordings tied directly to A/B test variations, so you can watch how each version actually performed.
- Form analytics tracking field-level drop-off and time spent per field.
- Funnel analysis that connects heatmap behavior to actual conversion funnel stages.
- AI-assisted insight summaries surfacing friction points automatically across pages.
Pros
- Deepest integration with a full experimentation platform
- Form analytics and funnel analysis included, unlike most competitors
- Scales well for high-traffic, multi-site enterprise use
- Strong segmentation and targeting controls
Cons
- No permanent free plan — trial only
- Pricing is largely sales-led and not fully transparent
- Overkill for a single small site or blog
- Steeper learning curve than Clarity, Hotjar, or Crazy Egg
Pricing
Published entry pricing for VWO Insights runs from roughly $139–$169/month, but most real-world contracts are quoted based on monthly tracked users (MTUs) and which modules (Testing, Insights, Personalize) you bundle together. Buying Insights alongside VWO Testing is typically cheaper than purchasing them as separate line items, and enterprise deals commonly land well into four or five figures annually depending on traffic volume.
Why We Recommend It
VWO Insights is the right call once heatmaps stop being a “nice to check occasionally” tool and start being part of a structured testing loop — hypothesis, test, watch the recordings, iterate. If that’s not where your team is yet, this is almost certainly more tool than you need, and the cost will feel hard to justify. For teams that are there, though, nothing else on this list ties behavior data to live experiments this cleanly. Our AI for UX optimization guide covers how AI-assisted insight tools like this one fit into a broader research stack.
5. Mouseflow
Best for Forms & FunnelsThe tool to reach for when the problem isn’t attention — it’s abandonment.
Overview
Mouseflow’s whole identity is built around one gap most heatmap tools leave open: form analytics. Where Hotjar, Clarity, and Crazy Egg tell you where people clicked and scrolled, Mouseflow goes a step further and tells you exactly which form field made someone quit — and lets you replay that specific moment. If checkout abandonment, signup drop-off, or lead-form completion is the number keeping you up at night, this is the tool built specifically for that problem.
Key Features
- Field-level form analytics: time-to-complete per field, abandonment point, and re-entry behavior.
- Funnel analysis to see exactly where visitors drop out of a multi-step process.
- Friction score, an automatic rating that flags pages with unusually high rage-click or erratic-movement behavior.
- Geographic and attention heatmaps in addition to standard click and scroll maps.
- Session recordings with filtering by inactivity, form interaction, and custom events.
Pros
- Best-in-class form and funnel analytics on this list
- Free plan available with a genuinely usable session cap
- Strong filtering and segmentation for finding specific friction points
- Competitive pricing relative to depth of features
Cons
- Interface feels denser and less polished than Hotjar or Crazy Egg
- No native A/B testing — pairs best with a dedicated testing tool
- Recording caps tighten at higher tiers, like most paid competitors
- AI insight features are more basic than VWO’s
Pricing
A free tier is available with limited monthly recordings. The Starter plan runs around $31–$32/month for roughly 10,000 recordings, scaling up to about $109/month for 50,000 recordings on the Growth tier, with custom Enterprise pricing above that for higher volume and advanced support needs.
Why We Recommend It
If your traffic isn’t the problem — your form is — Mouseflow will show you that faster than anything else in this comparison. It’s the tool I reach for specifically when a client says “people are adding to cart but not checking out” or “we get form starts but almost no completions.” For more on why forms leak conversions in the first place, our guide to improving dwell time covers related friction patterns worth checking alongside your Mouseflow data.
Best Heatmap Software by Use Case
Best Free Heatmap Software
Microsoft Clarity — unlimited everything, permanently free.
Best for Ecommerce
Mouseflow — field-level checkout and cart friction diagnosis.
Best for Agencies
Hotjar — collaborative workspace across many client sites.
Best for Startups
Microsoft Clarity — zero cost while validating product-market fit.
Best for SaaS
Hotjar — heatmaps plus in-app feedback and interviews.
Best for UX Research
Hotjar — Engage interviews plus qualitative feedback tools.
Best for CRO Teams
VWO Insights — heatmaps tied directly into live A/B tests.
Best Enterprise Solution
VWO Insights — scales across sites, brands, and traffic volume.
Best Budget Choice
Mouseflow — deep features starting around $31/month.
Best AI-Powered Option
Microsoft Clarity — Copilot summaries at no extra cost.
Buying Guide: How to Choose Heatmap Software
How Heatmaps Actually Work
A heatmap tool runs a small JavaScript snippet on your page that silently logs every click, tap, mouse movement, and scroll depth from real visitors, then overlays that data as color — red and orange for high activity, blue and green for low. Stack enough sessions together and patterns emerge that no single visit could show you.
- Click maps show exactly where people click or tap, including on elements that aren’t actually clickable — a huge tell that your design is confusing people.
- Move maps track mouse movement on desktop, which research shows correlates reasonably well with where people are looking, especially near the cursor’s resting points.
- Scroll maps reveal how far down a page visitors actually get before leaving, usually shown as a percentage of visitors reaching each vertical section.
- Attention maps (offered by tools like Mouseflow) combine scroll depth and time-on-section to estimate where visitors are actually reading, not just scrolling past.
- Confetti reports (Crazy Egg’s term) break click data down by segment — traffic source, referrer, device — so you can see if paid traffic behaves differently than organic.
Session Recordings, Funnels, and Form Analytics
Heatmaps are aggregate. Session recordings are individual — they let you watch a single anonymized visitor’s actual mouse path and taps in real time, which is invaluable for understanding a specific drop-off you noticed in the aggregate data. Funnels connect that behavior to your actual conversion steps (landing page → product page → cart → checkout), while form analytics zooms in even further, tracking which specific field caused someone to bail. If lead or checkout forms are core to your business, form analytics stops being a “nice to have” — it’s the entire point of installing the tool.
Sampling and Traffic Limits
Every paid tool on this list except Microsoft Clarity samples or caps recordings once you cross certain traffic thresholds — meaning it doesn’t capture literally everyone, just a representative slice. That’s usually fine for steady traffic, but worth knowing before a big launch or Black Friday spike, when the tool with the tightest cap can quietly miss your highest-value sessions.
Privacy, GDPR, and CCPA
All five tools reviewed here offer some form of data masking (hiding form input values, credit card fields, and password fields by default) and publish GDPR-compliance documentation, since they primarily serve EU and US customers. That said, compliance is a shared responsibility — you’re still expected to disclose heatmap and session-recording usage in your privacy policy and, depending on your jurisdiction, obtain consent via a cookie banner before the script fires. Don’t take a vendor’s “GDPR compliant” badge as a substitute for checking your own legal obligations.
Ease of Use, AI Features, and Support
Clarity and Crazy Egg are the fastest to install and read with zero learning curve. Hotjar sits in the middle — a bit more surface area, but still approachable. Mouseflow and VWO reward the time you put into configuring funnels and segments with noticeably deeper insight, but they ask more of you up front. Nearly every vendor now bakes in some AI summarization layer to cut down on manually watching hours of recordings — useful, but treat AI summaries as a starting point for investigation, not a final answer.
Heatmap and User Behavior Statistics That Actually Matter
Average online cart abandonment rate across ecommerce, meaning roughly 7 in 10 shoppers who add an item to cart never complete the purchase — the single biggest reason form and funnel analytics matter.
Source: Baymard Institute, meta-analysis of 50 studiesOf shoppers who abandon checkout cite surprise costs (shipping, taxes, fees) as the top trigger — a friction point that shows up clearly in session recordings right before exit.
Source: Baymard InstituteShare of words on an average web page that visitors actually read, rather than scan — which is exactly why scroll and attention maps matter more than raw pageview counts.
Source: Nielsen Norman Group eye-tracking researchAverage conversion-rate lift large ecommerce sites can gain purely from fixing documented checkout usability issues — no redesign, no new traffic required.
Source: Baymard Institute checkout usability testingMobile cart abandonment rate compared to desktop, underscoring why checking heatmaps by device type — not just in aggregate — is non-negotiable.
Source: Baymard Institute / Dynamic Yield benchmark dataEstimated recoverable annual revenue across US and EU ecommerce through better checkout design alone — the financial case for running heatmaps in the first place.
Source: Baymard InstituteThe pattern across nearly every credible UX dataset is the same: attention is scarce, friction is expensive, and most of it is invisible until you look at an actual heatmap or recording. If you want to go deeper on how these behavior signals connect to search performance, our Core Web Vitals guide and featured snippets optimization guide both touch on the UX side of ranking.
Expert Tips for Reading Heatmaps Correctly
- Wait for enough data before deciding anything. A heatmap built on 40 sessions is basically a guess. Aim for at least a few hundred sessions per page before drawing conclusions, more for low-traffic pages.
- Segment by device before you segment by anything else. Mobile and desktop behavior on the same page can look like two entirely different websites.
- Ignore clicks on non-clickable elements — until you don’t. A cluster of clicks on plain text or an image usually means visitors expect it to do something. That’s a design bug, not noise.
- Cross-reference heatmaps with recordings. A heatmap tells you where; a recording tells you why. Never act on one without spot-checking the other.
- Review reports on a schedule, not just after a redesign. Behavior drifts as your traffic mix changes — check monthly at minimum on high-value pages.
- Validate every heatmap-driven hypothesis with an actual A/B test before rolling a change out permanently. Heatmaps tell you where to look, not what will definitely work.
Common Heatmap Mistakes to Avoid
- Only checking desktop data. If more than half your traffic is mobile, and for most sites it is, desktop-only heatmaps are actively misleading.
- Making decisions on too little data. Small sample sizes produce heatmaps that look confident and mean almost nothing.
- Only looking at click maps. Clicks tell you engagement; scroll maps tell you reach; recordings tell you intent. Using just one is like reading one page of a three-chapter story.
- Never watching a single session recording. Aggregate heatmaps hide individual moments of confusion that recordings expose instantly.
- Testing five changes at once after one heatmap review. You won’t know which change actually moved the needle. Prioritize and test one variable at a time.
- Ignoring traffic-source segmentation. Visitors from a Google ad and visitors from an organic blog post rarely behave the same way on the same page.
- Skipping the A/B test. Rolling out a heatmap-inspired change without validating it is a common way good instincts turn into wasted development time.
Alternatives: Which Tool Wins in Each Scenario
| Scenario | Better Choice | Why |
|---|---|---|
| Zero budget, need data today | Microsoft Clarity | Unlimited and free, no trial clock running out |
| Need surveys + interviews too | Hotjar | Only tool here with built-in user research recruitment |
| Want A/B testing without a new tool | Crazy Egg | Testing is native, not a separate subscription |
| Running structured CRO experiments | VWO Insights | Heatmaps feed directly into live test variations |
| Checkout or lead-form abandonment | Mouseflow | Only tool with true field-level form analytics |
Frequently Asked Questions
What is heatmap software?
Heatmap software tracks how real visitors click, scroll, and move on your website, then displays that behavior as a color-coded visual overlay so you can quickly spot what’s getting attention and what’s being ignored.
How do website heatmaps work?
A lightweight tracking script logs anonymized click, scroll, and mouse-movement events from visitors, then aggregates them across many sessions into a single visual — warmer colors mean more activity, cooler colors mean less.
Are heatmaps accurate?
Heatmaps are directionally accurate once they’re built on enough sessions, but small sample sizes, sampling limits on some tools, and mixing device types together can all distort the picture. Always check sample size and segment by device before trusting a heatmap.
Which heatmap software is free?
Microsoft Clarity is free with no usage limits. Hotjar and Mouseflow both offer limited free tiers, and Crazy Egg has a restricted free option as well. VWO Insights does not currently offer a permanent free plan.
Is Microsoft Clarity really free?
Yes. Clarity has no paid tier, no traffic cap, and no credit card requirement. Microsoft monetizes it indirectly through its advertising and analytics ecosystem rather than charging users directly.
Which heatmap tool is best for Shopify?
Mouseflow tends to be the strongest pick for Shopify stores because of its field-level form and checkout analytics, though Microsoft Clarity is a solid free starting point for smaller stores.
Which software is best for WordPress?
All five tools install on WordPress via a simple script tag or plugin. Hotjar and Microsoft Clarity are the easiest to set up for non-technical WordPress site owners.
Can heatmaps improve conversions?
Heatmaps don’t improve conversions by themselves — they reveal where friction and confusion exist. Conversions improve when you act on that data through design changes validated by A/B testing.
Are heatmaps GDPR compliant?
Most reputable heatmap vendors, including all five reviewed here, offer GDPR-compliant configurations and data-masking features. You’re still responsible for disclosing tracking in your privacy policy and obtaining consent where required.
What’s the difference between session recordings and heatmaps?
Heatmaps aggregate behavior across many visitors into one visual summary. Session recordings show one individual visitor’s actual browsing session in real time, like a screen-recorded replay.
How many visitors do I need before a heatmap is reliable?
Most CRO practitioners suggest at least a few hundred sessions per page before drawing firm conclusions, and more for pages with highly varied traffic sources.
Can I use multiple heatmap tools at once?
Yes, and many teams do — for example, running Microsoft Clarity as a free baseline alongside Mouseflow or VWO for deeper form and funnel analysis. Just watch for any page-speed impact from running multiple tracking scripts.
Do heatmaps slow down websites?
A single well-implemented heatmap script typically adds a small, often negligible load-time impact. Running several tracking scripts simultaneously is more likely to cause noticeable slowdowns, so keep an eye on Core Web Vitals after installation.
Are heatmaps worth paying for?
For sites where conversions matter — ecommerce, lead generation, SaaS signups — yes. The insight typically pays for itself quickly once you fix even one meaningful friction point. For low-traffic hobby sites, a free tool like Clarity is often enough.
What is click tracking?
Click tracking records every click or tap a visitor makes on a page, including on non-interactive elements, which is then visualized as a click map showing hot and cold zones of engagement.
Which tool is best for agencies?
Hotjar is generally the strongest fit for agencies managing multiple client sites, thanks to its collaboration features and broad integration support.
Which tool has the best AI insights?
VWO Insights and Microsoft Clarity both offer notable AI-assisted summarization — Clarity’s Copilot is impressive given it’s free, while VWO’s AI insights tie more directly into experiment data.
Can beginners use heatmap software?
Yes. Microsoft Clarity, Hotjar, and Crazy Egg are all designed for non-technical users and require no coding knowledge beyond pasting a script tag or installing a plugin.
How often should I analyze heatmaps?
Review high-traffic and high-value pages monthly at minimum, and always re-check a page’s heatmap after any significant design or copy change.
What features matter most when choosing a heatmap tool?
Prioritize based on your actual problem: session recording depth for general UX issues, form analytics for checkout or lead-form abandonment, and A/B testing if you want to validate fixes inside the same tool.
Final Verdict
All five of these tools do the core job well — they just do it for different people.
- Best Overall: Hotjar — the most balanced feature set for most teams
- Best Free: Microsoft Clarity — unlimited data at zero cost
- Best Value: Mouseflow — deep form analytics without enterprise pricing
- Best Enterprise: VWO Insights — heatmaps tied directly into live experiments
- Best for Beginners: Crazy Egg — simplest path from install to insight
- Best for Ecommerce: Mouseflow — field-level checkout diagnostics
- Best for Agencies: Hotjar — collaboration across many client sites
The smartest move is rarely picking just one. Start with Microsoft Clarity because it costs nothing, then layer in Hotjar, Mouseflow, or VWO once you know exactly which problem — attention, research, or form abandonment — you’re actually trying to solve. Compare the free tiers side by side on your own site before committing a budget line to any of them.